How cannabinoids are distributed through the body depends to a large degree on the route of application; cannabinoids that are inhaled for instance will have a completely different distribution pattern than cannabinoids applied to the skin.
THC
To get an impression, let’s see what happens when THC is injected intravenously in pigs (pigs have very similar physiology to humans). When 200 μg/kg THC is injected, blood plasma will contain ± 24ng/g THC (see table below and (Brunet et al., 2006).
|
Hours |
||||
|
ng/g THC |
0,5 |
2 |
6 |
24 |
|
Blood |
24 |
4,8 |
1,6 |
0,2 |
|
Kidney |
272 |
57,1 |
3,3 |
0 |
|
Heart |
178 |
17,4 |
3,2 |
0 |
|
Lung |
1888 |
387 |
47,2 |
47,2 |
|
Muscle |
55 |
14,1 |
0,6 |
0 |
|
Spleen |
34 |
15,5 |
0,8 |
0 |
|
Fat |
91 |
50,1 |
33,9 |
31,6 |
|
Liver |
155 |
4,2 |
0 |
0 |
|
Brain |
49 |
14,6 |
4,4 |
0 |
|
Bile |
0,4 |
1,4 |
2,7 |
1,1 |
|
Vitreous humor |
1,2 |
0,3 |
0,1 |
0 |
24 ng/g corresponds to ± 0.076 μM THC in blood plasma.
If we look at the receptors that can be activated by THC (figure below), we see that some but not all receptors are activated by this plasma level (the bars that end up below the blue dashed line represent receptors that will be activated or otherwise manipulated by THC whereas the bars ending above the dashed line will be unaffected by THC).
However, as can be seen in the table above, most tissues retain higher levels of THC than plasma. This means that in those tissues more receptors will be activated by THC.
As cannabinoids are usually not injected, these data might be difficult to interpret.
The most popular way of cannabinoid administration is currently still smoking. When an average person smokes 35 mg THC this results in plasma values of ± 162 ng/ml corresponding to ± 0.5 μM THC (brown dotted line in figure above)(Huestis, 2007).
If we then adjust for the tissue multiplication factors from the table above, we find that smoking cannabis / THC can in principle activate most receptors in most tissues.
It should be noted that this activation will be transient; if we look at the bottom panel of the figure above we see that smoked / injected THC can reach relatively high levels which typically lasts only minutes.
Sublingual or oral application yields ± 30-fold lower maximum values, which can last several hours.
Topical application (to the skin) can locally produce millimolar values, which can last for days.
CBD
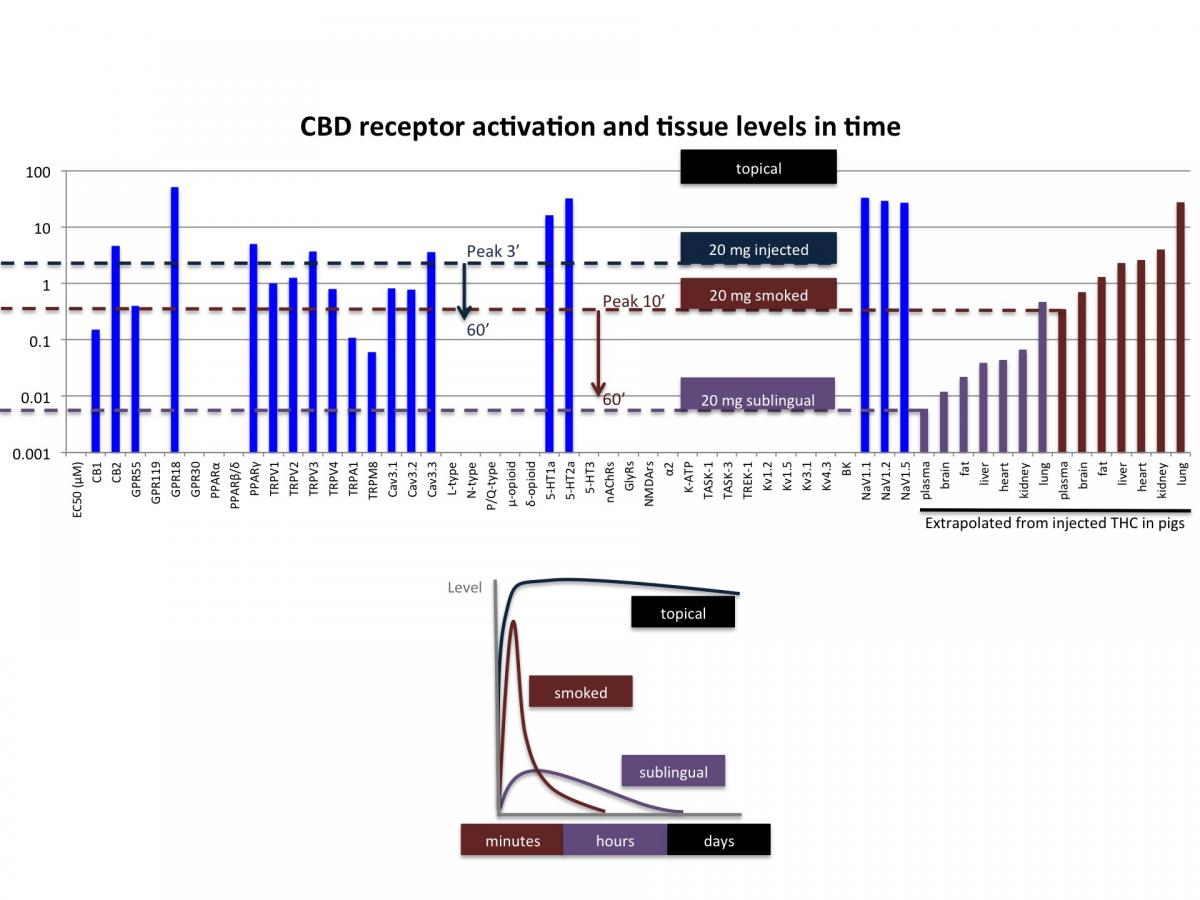
When we look at CBD (figure below), injection of 20 mg produces a peak plasma level of 686 ng/ml, corresponding to ± 2.2 μM (see references in CBD, pharmacokinetics section).
Smoking 20 mg CBD produces a peak plasma level of 110 ng/ml, corresponding to ± 0.35 μM.

When we adjust for the tissue multiplication factors from the table above (research so far suggests similar pharmacokinetics profiles for THC and CBD and presumably other plant cannabinoids), we find that smoking CBD can in principle activate most receptors in most tissues.
When we look at sublingual or oral CBD, we find that 20 mg produces relatively low plasma and tissue values, suggesting that most receptors in most tissues are probably not activated by this amount of CBD.
Please note that the data in the figures above is mostly extrapolated and derived from many different studies using different methodologies and experimental species.
In addition, there are large inter-individual differences in genetic make-up and factors like weight, fat percentage etc.
One should therefore be careful not to draw any explicit conclusions from these figures.
However, the figures above do allow some generalized conclusions:
· Different routes of application have different receptor activation spectra
· Different tissues have different receptor activation spectra
· Receptor activation is transient lasting minutes (smoking), hours (sublingual) or days (topical)
References:
Brunet, B., Doucet, C., Venisse, N., Hauet, T., Hébrard, W., Papet, Y., Mauco, G., and Mura, P. (2006). Validation of Large White Pig as an animal model for the study of cannabinoids metabolism: application to the study of THC distribution in tissues. Forensic Sci. Int. 161, 169–174.
Huestis, M.A. (2007). Human cannabinoid Pharmacokinetics. Chem. Biodivers. 4, 1770–1804.